
[Versión castellana | Versió catalana]
Peter Ingwersen
Royal School of Library and Information Science
University of Copenhagen
Abstract
Objective: This paper selects and outlines factors of central importance in the calculation, presentation and interpretation of publication analysis results from a scientometric perspective. The paper focuses on growth, world share analyses and the logic behind the computation of average numbers of authors, institutions or countries per publication indexed by Web of Science.
Methodology: The paper uses examples from earlier research evaluation studies and cases based on online data to describe issues, problematic details, pitfalls and how to overcome them in publication analysis with respect to analytic tool application, calculation, presentation and interpretation.
Results: By means of different kinds of analysis and presentation, the paper provides insight into scientometrics in the context of informetric analysis, selected cases of research productivity, publication patterns and research trends in the fields of renewable energy and wind power during different periods of history.
Resumen
Objetivos: detallar una selección de factores de importancia capital para calcular, presentar e interpretar los resultados de análisis de publicaciones desde una óptica cienciométrica, en particular con relación al análisis del crecimiento y de las cuotas mundiales, así como la lógica que hay detrás del cálculo de las medias de autores, instituciones o países por publicación indexados por Web of Science.
Metodología: ejemplos de estudios sobre evaluación de investigación anteriores y también de casos basados en datos recogidos en línea para este artículo demuestran conflictos, detalles problemáticos, inconvenientes y cómo superarlos en el análisis de publicaciones con respecto a la aplicación, al cálculo, a la presentación y a la interpretación de herramientas analíticas.
Resultados: proporciona una visión de la cienciometría en el contexto del análisis infométrico, casos seleccionados de productividad de investigación, patrones y tendencias de investigación de publicaciones en todas las disciplinas y en los campos de la energía renovable y la energía eólica en diferentes periodos de tiempo y mediante diferentes tipos de análisis y presentación.
1 Introduction
In principle, publication analysis implies to count publications in various ways and to compute a variety of distributions, e.g. articles over journals or top-productive authors or institutions, or research indicators, like number of articles published per scientist per year as well as to take time into account. Publication analysis is a fundamental prerequisite for citation analysis and citation impact calculations. Commonly the publications under examination are peer reviewed and in general one limits the analysis to specific document types, such as journal articles, conference proceedings papers or books; more recently Web publications like blogs, open-access articles or download volume and other usage measures are included. One may analyze publications or their metadata concerned with
- Authors of publications like number of authors per article
- Communication channels, like journals, conference proceedings, blogs, web sites
- Academic fields or disciplines
- Countries, regions, universities, departments, research groups, like most productive entity
- Time periods, in the form of time series, e.g., displaying publication growth
- Mixtures of the above, like no. of journals in a field used by a country over time
Publication analysis is done assuming that research publication patterns —to a large extent— mirror research patterns. If done with traditional printed or electronic publications the analyses are of Bibliometric nature, Diagram 1. If the publications are of academic nature one would name the analysis Scientometric (Moed, 2005), regardless of the kind of publications; if the publication environment is the Web we call it Webometrics (Almind & Ingwersen, 1997; Thelwall, Vaughan & Björneborn, 2004). If we are counting units based in various social media the concept Altmetrics (for alternative metrics) has recently surfaced as a special form of Webometric analysis (Taraborelli, 2008; Kurtz & Bollen, 2010). As shown in Diagram 1 the entire range of ‘metrics’ belong to the overall field of Informetrics, the quantitative study of information in all its forms (Tague, 1992).
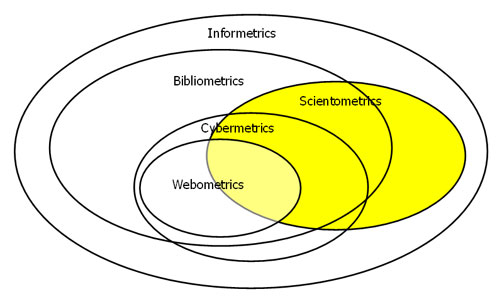
Diagram 1. The framework of Informetrics (from Björneborn & Ingwersen, 2004, p. 1217).
We will below discuss some examples of basic scientometric publication analyses, their inherent problem of interpretation and note some of their pitfalls. The first example demonstrates the use of index figures for growth of research publications over time for three very different countries and regions in terms of research volumes, i.e., USA, China and EU. Some pitfalls in the interpretation will be highlighted. The second case displays a time series of research world shares of countries/regions in a scientific discipline. In this case going behind the shown developments is vital for the correct interpretation of the trends. The third case demonstrates how one may utilize the Analysis Tools of Web of Science (WoS) to calculate average number of countries, authors or institutions per publication in a given discipline, without actually controlling the author or institutional names. Most of the examples are from already published analyses, so that readers may consult these publications for further understanding of the cases.
2 Publication growth analyses
Diagram 2 displays the growth of research publications for China, USA and EU 1981-2006 in 5-year running periods. Research publications are here solely journal articles. The overlapping running periods serve to smooth the curves in the figure. Because of the large differences in publication amounts between the three countries/regions, the actual number of publications is commonly not shown in the same diagram; hence the application of index values. In addition index values provide the reader with immediate information on the growth from a given point in time. The initial period (1981-1985) is set to index value 1. Consequently, in order to understand the trends shown in the figure it is crucial to know (1) from which data source the index figures derive and (2) the actual volume of publications per country or region equaling index value 1.
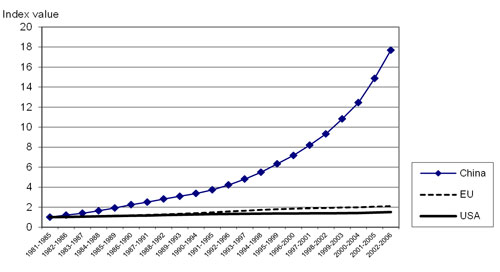
Diagram 2. Publication growth in Thomson-Reuter’s Citation databases for China, EU and USA —all academic fields, 1981-2006 (Web of Science; National Science Indicators, 2007)— from Ingwersen (2009, p. 4).
In the original article (Ingwersen, 2009, p. 4, Diagram 3) the volumes for index value = 1 was not displayed because the idea in that article was alone to demonstrate the second crucial point for interpretation outlined above: the source. On the surface it looks like China outperforms the other two major players. Nevertheless, as the article states (p. 4): “[we] observe that on the surface China’s growth seems to follow a power law. However, the diagram demonstrates alone the growth of China’s publications indexed by Thomson Reuters in their three citation databases, Social Science Citation Index, Science Citation Index and Arts & Humanities citation Index. That is, the curve for China signifies the growth of China’s international contributions, as indexed by the citation databases, not the real growth of all Chinese publications including those published nationally.” In other words: the Chinese curve informs about the 18-fold growth of Chinese publications during the last 25 years, most likely in English and indexed in the international citation databases; in short the recent Chinese penetration into the international scene. Similar phenomena of growth, but less pronounced, can be observed for other non-English speaking countries, e.g., for Spain and many South American countries. The diagram can thus be seen as a representation of an active research policy in China.
Another point is that since the figure displays growth by index values, not real number of publications over the periods, it would be a misinterpretation that China outperforms EU which outperforms USA in recent years; the actual publication volumes equaling index value 1 are such that the starting point for China is far below those of EU and USA —only 14,114 publications. The US volume at index 1 corresponds to 887,039 publications against the 736,616 publications for EU as the starting point. A diagram depicting the real numbers of articles would yield the real trend —see Diagram 3 below. A table showing all three countries/regions and their actual publication numbers would also serve to put the picture right —but is of course less spectacular.
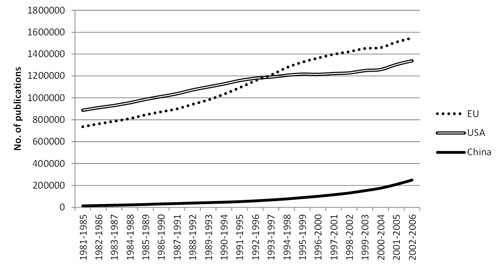
Diagram 3. Publication numbers in Thomson-Reuter’s Citation databases for China, EU and USA 1981-2006 (Web of Science; National Science Indicators, 2007).
3 World share analysis
The second example concerns analysis of publication world shares in a discipline, Renewable Energy research. Publications cover journal articles and conference proceedings papers. The trends displayed are assumed to mirror research trends and productivity, i.e., the top-productive countries or regions in a field over time.
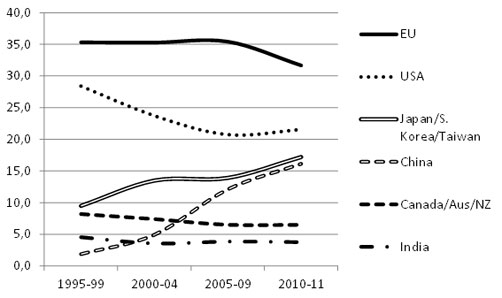
Diagram 4. World shares in % of Renewable Energy research publications 1995–2011 (WoS 2012) —from (Sanz-Casado et al., 2013, p. 206).
In contrast to Diagram 2 Diagram 4 provides the actual proportional trends for the countries and regions analyzed. It is consequently acceptable to display the time series with different analysis periods (three 5 years period and one 2 years period, 2010-11). In order to understand the diagram patterns the underlying data should be given in form of a table, so that the reader may know the actual development of the world output in the discipline for the analyzed periods. However, a complete table would be too large to display. Table 1 below demonstrates the top-fraction of the data. Prior to add up the publication numbers for EU or other regional countries to be displayed in the diagram the overlap between them must be eliminated. Seen from the analyst and the reader points of view, for time series of national world shares one should always ask: which countries and which document types are responsible for the patterns shown? Do some anomalies occur as to citation impact of advancing or declining entities? For instance, does China or Japan/S. Korea/Taiwan raise productivity as well as citation impact 2005-11?
The analysis should consequently at least discuss the observed significant trends in Diagram 4.
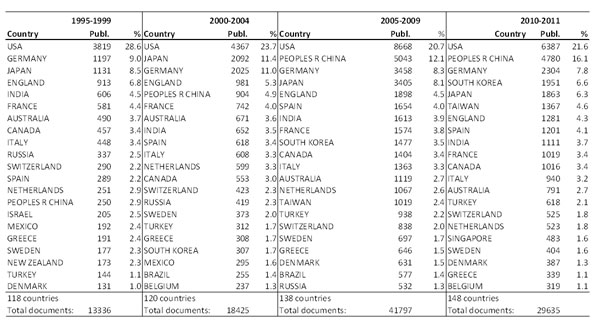
Table 1. Journal articles and proceedings papers published on Renewable Energy Generation 1995-2011 in the top-20 countries (Web of Science, 2013; from Sanz-Casado, et al. 2013, p. 205).
(1) Although the leading position of EU in Renewable Energy research is not challenged the drop in shares in 2005-11 should be investigated. It appears that the major reason is a German reduction of research in this field (from 11.4 % in 2000-2004 to 7.8 % in 2010-11). “[In] general the ‘old’ dominant Western economies: USA, EU, Canada, Australia and New Zealand reduce their world segments during the analysis period. Simultaneously, the share of the countries outside the diagram diminishes, from 21.7 % in 2000–2004 to 12.7 % in 2010–11. India stays rather constant just below 4 %. Only China raises its world share and actual publication volume (or their international penetration as measured by WoS —see above) very rapidly, to become the second top-player from 2004 at global level in Renewable Energy research.” … “[Japan], South Korea and Taiwan supersede China in volume and also increase their segment, but not as steeply as China, mainly due to a reduced Japanese growth.” (Sanz-Casado et al., 2013, p. 204). A typical hidden variable in this type of analysis might be the degree of international collaboration, which should be addressed. Reduced collaboration commonly implies lower productivity —and entails also lower citation impact.
(2) With respect to document type distribution and impact selected detailed analyses, Table 2, show that the major portion of the increase 2005-11 in world shares for China derives from journal articles, like in USA (approx. 66 %). In Spain, ranked sixth 2005-09, this share is much larger (73 %). But note the very low international impact of the Chinese proceedings papers, compared to that of other top-countries.
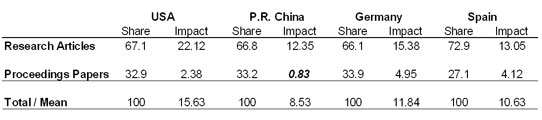
Table 2. Document types and citation impact for the period 2005-11 cited 2005-12 in Renewable Energy research (Web of Science, 2014).
4 Average number of countries, institutions and authors per publication
It is quite straightforward to calculate the average number of countries per publication in Web of Science, because all the participating countries are indexed and controlled for name form. The WoS Analytic Tool allows the analyst to obtain a breakdown into cooperating countries of a set of publications defined by a country (in a field, at a given time, from a particular document type, etc.) online. The ranked output from the tool (up to 500 different countries) can then be transferred directly to a spread sheet. It will look like Table 3A. The analyzed set of documents in international cooperation with the country in question (in Table 3 it is Denmark) is selected in WoS by retrieving all documents within the Danish set that are collaborating with Denmark. Those countries are found by means of the Analytic Tools of WoS. The resulting set, here named the ‘international set’, is then subtracted from the original Danish set by means of NOT-logic. We have thus two sets of documents from Denmark: the ‘international set’ and the set consisting of publications only published by Danish institutions, not by other countries. This we could name the ‘Danish only’ set. We are now ready for average calculations of countries or institutions per document in the respective sets.
4.1 Breakdown of collaborating countries and average per publication
In the example Table 3A the ‘international set’ on countries collaborating with Denmark is 100 proceedings papers from 2012 in Renewable Energy research. The remaining ‘Danish only’ set consists of 851 proceedings papers (Table 3B). In order to calculate the average number of countries collaborating with Denmark when producing the 100 conference proceedings papers one sum up the number of publications assigned all the countries on the list. The number of different unique countries naturally serves as an additional indicator of cooperation (the actual number is 43 unique countries, not displayed in the table), but has no influence on the average calculation. The sum of proceedings papers for all the countries including Denmark (100 publ.) is 333 papers, Table 3A, and the average number of countries per paper is thus 333/100 = 3.33 countries. The 333 proceedings papers is a much larger number than the 100 collaboration papers from Denmark exactly because several countries cooperate. So, aside from Denmark itself on average 2.33 other countries cooperate to produce the 100 proceedings papers.
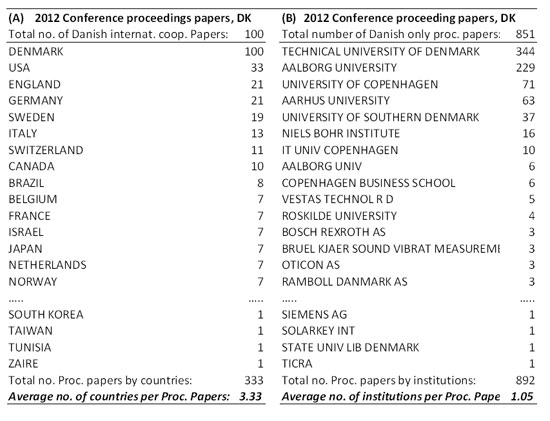
Table 3. Danish proceedings papers from 2012, all fields. Breakdown of countries cooperating with Denmark and mean number of countries per paper (3A). Breakdown of Danish institutions collaborating in Danish only proceedings papers and mean number of institutions per paper (Web of Science, 2014).
4.2 Breakdown of collaborating institutions and average per publication
In Table 3B the ‘Danish only’ set (851 proceedings papers) is broken down into the institutional names originally stated in the papers at publishing time by means of the WoS Analytic Toolkit with respect to the metadata category of ‘Organizations Enhanced’. In difference to the country names the institutional names are not controlled. We observe for instance that Aalborg University (indexed in 229 papers) also appears under the name form ‘Aalborg Univ’ (indexed in 6 papers). Likewise, inside knowledge would inform that ‘Niels Bohr Institute’ actually forms an integrated part of University of Copenhagen. Consequently, we cannot apply the breakdown to say anything about the real number of unique institutions that collaborate in the purely Danish set of papers. Or we should clean up the entire set first. However, the total number of documents containing at least one institutional name can be computed by aggregating the number of documents assigned each ‘Organization Enhanced’ in the set.
This aggregated number of proceedings papers (892, Table 3B) is then divided by the number of documents in the ‘purely Danish’ set (851) to produce the average number of institutions per paper (1.05). It is important to emphasize that in this calculation name form control of institutions is not necessary. Since only one name form of each affiliated institution is commonly assigned each document by the authors, logic dictates that this calculation involving institutional names signifies the true average number of different institutions collaborating per document.
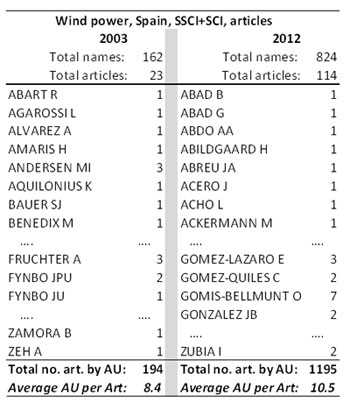
Table 4. Breakdown of author names collaborating on Wind Power research in Spain 2003 and 2012, sorted alphabetically and average number of authors per article (Social Science Citation Index (SSCI) and Science Citation Index (SCI), 2014).
4.3 Breakdown of collaborating authors and average per publication
The average number of authors —and the average number of collaborating institutions— is often used as measures in research evaluation studies to explain changes in citation impact and to justify the use of fractionalization of citations or publication performance indicators. In principle the same kind of calculations and analytic tools are applied to a defined set for the breakdown and average computing of authors. Like for country names all author (AU) name forms are indexed in WoS and to a great extent controlled (but rarely in other scientific databases, which commonly do not display secondary authors). Observe e.g. Table 4. As above for institutions, the level of name control does not influence the average of authors per document computation. We may consequently calculate the average number of different author names per document by means of the same kind of aggregation and logic as used above for institutions or countries.
Table 4 demonstrate an example of such calculations for a time series concerned with articles indexed in WoS in the science and social science databases on Wind Power research in Spain covering two publication years: 2003 and 2012.
We observe the high degree of control of name forms, although some uncertainty may arise for ‘FYNBO JPU’ and ‘FYNBO JU’ which probably signify the same person. In the shown case the average number of authors per article has increased by approx. two authors over the ten years analyzed.
5 Discussion and conclusions
The following characteristics and elements are crucial for making valid interpretations of the analysis results and presentations:
- Data source quality and validity. Does the source contain all the required data, e.g. all authors or document types, and in which manner of control?
- Expert knowledge. In each scientometric analysis two kinds of experts are necessary: the specialist with bibliometric expertise and a domain expert who may explain anomalies in the observed trends, e.g. unknown field-dependent variables/effects or explain name forms;
- Way of presentation. Chose the adequate presentation mode, e.g. use index values instead of the real numbers because one diagram cannot cover all numeric ranges and details; but assure to provide enough underlying data for interpretation in informative legends.
The reason behind the use of WoS (or Scopus) is fundamentally about completeness. Aside from also being able to make citation analyses the citation databases provide the analyst with a number of analytic tools rarely available in domain-dependent databases. In addition, the citation databases commonly index all or most metadata, e.g. all authors and their affiliations, while other sources only index some metadata, e.g. first author and its affiliation. However, WoS and Scopus are still biased towards Anglo-American sources.
The name form control is an important issue because in the case of rigorous control of institutional or author names additional indicators of productivity arise. If the true number of research institutions or authors is known it is possible to calculate the productivity of individual entities. From Table 4, for example, one obtains the same productivity per author in 2003 = 23 art. / 162 unique names = 0.14 article per scientist, as in 2012 (114/824 = 0.14), although the average number of collaborating scientists has increased 25 % over the ten years.
The expert knowledge is vital for the interpretation, as we have shown in connection to Diagram 2. Since most chart types display averages or aggregations the underlying structures of data may show important outliers or explain certain developments —as in connection to Diagram 4 on China. Adequate and informative captions and legends of diagrams and tables are central to minimize misunderstandings. It should always be possible to apprehend the meaning and message of a figure directly from the figure itself supported with the caption. Necessary information should not be packed away into the text body.
In conclusion this contribution has demonstrated selected cases of publication analysis, their presentation of results and their possible interpretation, including major pitfalls. The importance lies in understanding that citation analysis and citation impact analyses can only be done by means of valid publication analyses. In order to carry out the former analyses, results from the latter are mandatory as normalization devices. Besides, in themselves publication studies provide insights into productivity, research (publication) patterns and trends.
References
Almind T.C. & Ingwersen P. (1997). Informetric analyses on the World Wide Web: methodological approaches to Webometrics. Journal of Documentation, 53(4): 404-426.
Björneborn, L. & Ingwersen, P. (2004). Toward a Basic Framework for Webometrics. Journal of the American Society for Information Science and Technology, 55(14): 1216-1227.
Ingwersen, P. (2009). Scientometric and Webometric methods. In: Document, Information and Knowledge, Wuhan University, China: p. 1-11. ISSN: 1003-2797
Kurtz, M. & Bollen, J. (2010). Usage bibliometrics. Annual Review of Information Science and Technology, 44, 3-64.
Moed, H.F. (2005). Citation Analysis in Research Evaluation. Dordrecht: Springer.
Sanz-Casado, E., Carlos Garcia-Zorita, J., Serrano-López, E.A., Larsen, B. & Ingwersen, P. (2013). Renewable energy research 1995–2009: a case study of wind power research in EU, Spain, Germany and Denmark. Scientometrics, 95:197-224
Tague-Sutcliffe, J. (1992). An introduction to informetrics. Information processing & management, 28(1): 1-3.
Taraborelli, D. (2008). Soft peer review: social software and distributed scientific evaluation. In: Hassanaly, P. and Ramrajsingh, A. and Randall, D. and Salembier, P. and Tixier, M., (eds.) Proceedings of the 8th International Conference on the Design of Cooperative Systems, Carry-le-Rouet, 20-23 May 2008. (pp. 99-110). Institut d’Etudes Politiques d’Aix-en-Provence: Aix-en-Provence, France.
Thelwall M, Vaughan L & Björneborn L. (2004). Webometrics. Annual Review of Information Science and Technology, 39: 81-135.
 Creative Commons licence (Attribution-Non-Commercial-No Derivative works). They may be consulted and distributed freely provided that the author and publisher are quoted (in accordance with the “Recommended citation” section in each of the articles). However, no derivative works (translation, change of format, etc.) may be made without the publisher’s permission. Therefore, it meets the definition of open access form the Budapest Open Access Initiative declaration. The journal allows the author(s) to hold the copyright without restrictions and to retain publishing rights without restrictions.