
Jordi Molas-Gallart
INGENIO (CSIC-UPV)
Universitat Politècnica de València
Ismael Ràfols
INGENIO (CSIC-UPV)
Universitat Politècnica de València
Abstract
The spread of bibliometric indicators in research evaluation and policy has been accompanied by an increasing realisation that indicators’ use is often problematic and/or inappropriate. In this article, we propose a parsimonious framework to analyse the conditions under which the use of indicators become problematic. We propose that indicators’ use in evaluation can breakdown for three reasons. First, because the parameters of the models linking properties and indicators are unstable and, as a consequence, indicators cannot be compared across spaces or time. Second, because the underlying models are incorrect. Third, because the property of the indicator is irrelevant for the issue examined. This framework can be particularly helpful in fostering an understanding of the problems of conventional indicators in “peripheral” spaces – i.e. in geographical, linguistic or disciplinary areas that are in the margins of the science system.
Resum
La generalització dels indicadors bibliomètrics en l’avaluació de la recerca i en el disseny de polítiques ha anat acompanyada d’una percepció cada cop més estesa segons la qual l’ús d’aquestes eines sovint és problemàtic o inapropiat. En aquest article presentem un marc senzill que permet analitzar les condicions en què l’ús d’indicadors com a mètode d’avaluació pot fallar. Els motius d’aquests errors poden ser tres. En primer terme, pot ser que els paràmetres dels models que relacionen les propietats i els indicadors siguin inestables i, per tant, que els indicadors no siguin comparables en el temps o en l’espai. En segon lloc, pot ser que els models emprats siguin incorrectes. Finalment, pot ser que la propietat de l’indicador sigui irrellevant en relació amb l’objecte d’estudi. Aquest marc que proposem pot resultar especialment útil per a comprendre els problemes que representa l’ús d’indicadors convencionals en espais “perifèrics”, és a dir, en àrees geogràfiques, llengües o disciplines que se situen en els marges del sistema científic.
Resumen
La generalización de los indicadores bibliométricos en la evaluación de la investigación y en el diseño de políticas ha ido acompañada de una percepción cada vez más generalizada según la cual el uso de estas herramientas a menudo es problemático o inapropiado. En este artículo presentamos un marco sencillo que permite analizar las condiciones en las que el uso de indicadores como método de evaluación puede fallar. Los motivos de estos errores pueden ser tres. En primer lugar, puede ocurrir que los parámetros de los modelos que relacionan las propiedades y los indicadores sean inestables y, por lo tanto, que los indicadores no sean comparables en el tiempo o en el espacio. En segundo lugar, puede pasar que los modelos empleados sean incorrectos. Finalmente, puede suceder que la propiedad del indicador sea irrelevante en relación con el objeto de estudio. Este marco que proponemos puede resultar especialmente útil para comprender los problemas que representa el uso de indicadores convencionales en espacios “periféricos”, es decir, en áreas geográficas, lenguas o disciplinas que se sitúan en los márgenes del sistema científico.
1 Introduction
Scientific communication practices are in a state of flux. The unprecedented global access to massive sources of data and information enabled by the Internet has changed the means of communication and, significantly, the uses that can be made of such means. For instance, the ability to access and analyse millions of academic journal articles has made of the electronic article (and informational content as meta-data) a source of data that is being used for analytical and evaluation purposes. The proliferation of indicators based on publications and citations has turned what used to be, solely, a communication channel into the foundation of a complex system of evaluative metrics. And, as articles and other electronic publication channels are used for purposes other than communication, and in particular for evaluation, the publications strategies of scientists have also adapted. The contents and the channels of scientific communications are being shaped by what is being measured and why (De Rijcke et al., 2016).
This article focuses on the use for evaluation purposes of indicators derived from scientific communication sources, and the limitations and challenges that this use faces. Bibliometric indicators have become increasingly salient in research assessment and strategic planning. >Gläser and Laudel (2007) suggest three main reasons why they are being increasingly used to evaluate knowledge production and compare the performance of knowledge production units (from individuals to nations). First, the growing demand for evaluations cannot be fulfilled by substantive peer review: bibliometric indicators emerge as a faster and more economic means of evaluation. Second, as they are based on research outputs that have been validated by several scientific peers, bibliometric indicators are perceived to be “objective”measurements, more reliable than “subjective”peer review. Third, bibliometric indicators are apparently accessible (i.e. understandable) to politicians and managers, and seem to reduce the need to resort to specialised scientists to act as peer reviewers; bibliometric indicators can be seen as a direct way for those funding research to avoid the “principal-agent” problem (van der Meulen, 1998). While peer assessments require in-depth knowledge of the characteristics and practices of the relevant research fields, the interpretation of the numbers generated by bibliometric analysis is often believed not to require specialised, contextual knowledge. The use of bibliometrics appears to be simpler and more straightforward than basing decisions on, for instance, qualitative assessments of research performance. Also, in countries in the peripheries of the science system, conventional bibliometric indicators can be perceived as having the “international” legitimacy that peer reviews (which are local) do not have (Ràfols et al., 2016).
In this situation, decisions on the design and implementation of science policies are increasingly being informed or even determined by the comparative use of quantitative indicators. Benchmarking, rankings, and the direct comparison of single indicators (whether synthetic or reflecting a single dimension) are expressions of this trend. But the lackadaisical use of indicators is plagued with pitfalls, which is why appeals to responsible use of indicators have proliferated in recent times (Hicks et al., 2015, Wilsdon et al., 2015) .
This paper differentiates three different sets of problems that beset scientometric indicators and their use. We explore when these indicators do not offer an adequate approximation to the properties they are expected to reflect and the reasons why the problems emerge. In so doing, we will identify spaces that are insufficiently or unevenly covered by existing indicators. Because research and the communication of its results are directly affected by the use of a narrow set of bibliometric indicators for evaluation (the use of bibliometric indicators displace the original objectives of research activities and policies) (Rijcke et al., 2016), the problems we will discuss have an effect on research activities including the reinforcement of the peripheral nature of some of the evaluation subjects (Chavarro et al., 2017, Vessuri et al., 2014). We will discuss this problem by means of a set of examples derived from current literature.
2 Analytical framework: Properties, metrics and indicators
Societies and individuals value properties that are not directly observable. Many of the ultimate objectives of public policy fall within this category: welfare, security, and health are not directly observable but nevertheless are properties we consider important. However, although we may not be able to observe these properties directly, we may be able to make other observations and use them as indicators that can offer a valid and useful representations of the properties. We may assume, for instance, that the citations an article receives reflect its “academic quality’,1 or its “scientific impact’, or both; and that, therefore, the observation of citations provides an approximation to, and an indicator of, the property “academic quality” of a specific piece of scientific research
For the sake of clarity let us make explicit the terminology we use in this paper. By properties we understand the general attributes or characteristics of research that we aim to capture (‘academic quality’, “intensity of collaboration’, “diversity of knowledge’, “brokering role’, etcetera). By indicators we understand the observables that can be empirically and directly recorded (citations, number of authors, number of disciplines, number of bridging positions, etcetera), and that can be related to a property through a theoretical model (see Figure 1). In short, indicators are observations (qualitative or quantitative) that are supported by a conceptual or theoretical model to represent a system’s property. By parameters we understand the numbers that provide the references for comparison between the observation and the models. As we will discuss, parameters may change with context.2
We would like to emphasize that the link between indicator and the property it reflects is mediated by a theoretical model, either explicitly or implicitly. For instance, in the case of citations, Merton’s theory of citations as a form of recognition provides the theoretical model that justifies that citations are an indicator of quality. Or for example, R&D expenditure provides an estimate of the effort invested in scientific and some technological activities. If we assume the linear model of innovation in which scientific research generates knowledge that it is then used to generate technological developments, which in turn lead to innovations that increase wealth and welfare, then R&D expenditure can be considered as an indicator associated with (future) wealth and welfare improvements. If the underlining models are more complex, considering, for instance, that innovative activities are developed through feedback processes involving a variety of actors and activities, then an approximation to innovation and its effects will require a larger number of indicators reflecting a broader set of activities, like those used in the Community Innovation Survey and defined through documents like the “Oslo Manual”.
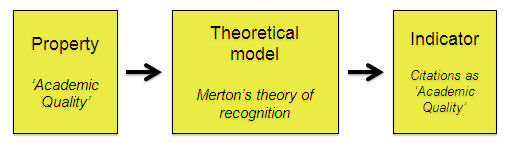
Figure 1. Relation between property and indicator. An indicator is a proxy to measure a property when there is a theoretical model that relates the property to the observations of the indicator.
There are two main consequences that follow from this discussion.
- First, and rather obvious but often forgotten, an indicator is related to a property of interest, but is not the same as the property. This is particularly relevant when indicators are used to inform policy decisions. The properties of interest are likely to be different in different policy contexts, and therefore the relevance of a specific indicator will not be the same across different policy environments.
- Second, the link between indicator and property assumes some theoretical understanding of how indicator and the property are related. Again, the adequacy of the theoretical assumptions on which the validity of the indicator rest may change across contexts or over time. These relationships hold under particular conditions, and therefore the capacity of an indicator to reflect a property of interest depends on whether these conditions hold in the specific environment in which the indicator is applied.
For both reasons, the validity of any indicators is context-dependent. What works in one situation, may not work in another. However, the most common evaluative use of indicators is for comparative purposes. For instance, as mentioned above, the main reasons for the evaluative use of bibliometric indicators are all related to situations in which evaluation is conducted for making choices about alternative options, often related to resource distribution. In these circumstances, it is paramount that the model that links indicator and property be the same in all the cases where the indicators are applied. We define this situation as one in which the model needs to be horizontally stable (meaning comparable for different contexts at a given time). In other circumstance the indicators may be used to carry out longitudinal analysis or compare situations over different periods of time (we may want for instance to identify the effects of a policy by comparing the situation before and after the interventions is made). In these cases, we need the model linking indicators and property to be stable over time, i.e., it needs to be longitudinally stable.
Lack of stability in the model linking indicator and property is only one of the reasons why an indicator may provide an inadequate representation of reality. In the following section, we review the different reasons why indicators may be unfit for evaluative purposes under certain conditions.
3 Scientometric indicators: sources of MIsrepresentation
We can distinguish three main sources of problems causing indicators to misrepresent the qualities of interest in a specific context: the identification of the property of interest, the model linking property with indicators, and the stability of this model. For an indicator to provide relevant information, all of these three aspects must behave according to the assumptions underpinning the validity of the model: the property must be relevant, the model correct, and its indicators must be stable. If there is a failure in any single one of these conditions the use of the indicator will be inappropriate, as summarised in Table 1:
| Sources of misrepresentation | |||
|---|---|---|---|
| Unstable Parameters | UNSTABLE | Correct | Relevant |
| Incorrect Model | Stable | INCORRECT | Relevant |
| Irrelevant Property | Stable | Correct | IRRELEVANT |
Table 1. Potential problems causing indicators to misrepresent qualities of interest.
The rest of this paper will describe the three situations listed in the table above; that is, the three situations in which a single one of the three conditions does not hold:
- The model that links indicator and property of interest does not hold in the same way for all the situations in which it needs to be applied. Although the model is correct, its parameters of the model change across cases (left column).
- The model is incorrect, even if it is stable and relevant. That is, the indicator and the property it purports to reflect are located in an area that is important for the policy problems we are interested in and the model that links property and metric is stable. Yet, the model is wrong in the sense that makes assumptions about the relationship between property and indicator that are not supported by our current understanding of reality (central column).
- The model linking indicator and property is stable, but the properties it reflects are, from a policy perspective, unequally relevant. The indicator is forcing us to look into properties that are not the ones that, in the specific policy context under consideration, we should be interested in (right column).
We analyse each one of them in turn.
4 Unstable parameters
Indicators are applied to heterogeneous populations, and it is therefore possible that the model that links indicator with property does not hold equally across all the population. In other words, the parameters of the model linking property and indicator are not the same for all the cases under comparison. Such instability can occur horizontally among different subjects at a given point in time, or longitudinally across different points in time for the same subject. In these situations, different observations of subjects displaying similar levels of the property of interest will display different indicator readings.
An example of this situation is the unequal coverage of different disciplines, languages and types of research by the journal databases more commonly used in bibliometric analysis (Web of Science and Scopus) (Vessuri et al., 2014; Chavarro, Tang and Ràfols, 2017). Here the model would link the citations they receive with the academic quality of the research of an individual or group. The aim of a scientist, the model would go, is the diffusion in the scientific community of the results of his or her scientific work; for this there are long established communications means in the form of scientific journals. Good research will have the qualities that makes it influential and such influence is reflected in the citations an article receives according to Merton’s theory of recognition. In this way citations become an indicator of “research quality’. In spite of critiques by rigorous analyses (Martin and Irvine, 1983), citations have long been assumed to be an indicator of “research quality’, being used at all levels of analysis (from individual performance assessments to the benchmarking of national level performance), either directly, or underpinning other indicators like the journals “impact factor’.3
Yet, even if we accept that citations do indeed reflect quality in different fields of research (as we will see below this is not always the case), patterns of publications and citation differ across research fields. Consequently, citation patterns vary across disciplines and research fields. Thus, citation impacts and impact factors of Cell and Molecular Biology journals are several fold larger than those in Mathematics (Althouse et al., 2009). These differences have been associated to differences across disciplines in the fraction of citations that go to other listed journals, and the total average number of outgoing citations per article; thus, “Those fields which cite heavily within the ISI data set, such as Molecular Biology or Medicine, buoy their own scores. Those fields which do not cite heavily within the ISI data set such as Computer Science or Mathematics have correspondingly lower scores” (Althouse et al., 2009).
It follows that a direct comparison across different fields of indicators based on citations in different fields is unwarranted because the model is not “horizontally stable’: the pattern of citation generation varies across disciplines and, therefore, the specific way in which the citation is linked with influence and quality also varies. One citation in mathematics does not mean the same thing as a citation in biology.
This problem has been addressed through normalisation, i.e. by dividing the citation of an article by the average number of citations in a field. Although we have the same indicator, now the model states that citations capture academic quality “in comparison to’. This is operationalised by “normalising” indicators, taking into consideration the propensity to cite in the fields of publication; either by using weighted citation indicators or by considering the impact factor of journals by comparison to journals within their own discipline. In fact, the way to calculate the weighting of citations in different fields in order to be able to generate cross-disciplinary citation-based comparisons has been the subject of hot debates and different proposals for many years (Opthof and Leydesdorff, 2010). Even then, we can still find different propensities to cite within different types of research (e.g. basic vs. applied) classified in the same disciplinary category of Web of Science (Van Eck et al. 2013). Further, in spite of widespread critiques (DORA, 2013; Hicks et al., 2015), it is still common to use the impact factors of the journal where an article has been published as an indicator of the quality of the research whose results have been expressed through the article.
Similar differences in coverage, occur across languages. The fact that the most widely used bibliometric datasets (WoS and Scopus) have better coverage of English language publications than of any other language has long been noted as a shortcoming affecting all indicators based on this data. While in the natural sciences the use of English as lingua franca is increasingly well-established, the use of national language is important in the social sciences, humanities and law, affecting the international visibility of publications in these fields (Van Leeuwen, 2013, p. 1). National languages are also important in professional disciplines like clinical medicine.4 Again, because of unequal coverage, the model that links the number of citations (or the number of publications) with the quality of research does not hold in the same way across researchers, when the language in which they express their scientific finding is different.
Finally, quality is not linked to citations (or highly-cited journals) in the same way when the research focuses on the empirical analysis of topics of local relevance and when the research addresses, for instance, theoretical themes of general relevance (Chavarro, Tang and Ràfols, 2017). More importantly, differences are also found among research focused on themes of local importance across different localities. The presence, or rather lack of presence, of certain local topics from the “top” academic literature does not seem to be random. For instance an often quoted comment by the editor of the top-rated medical journal The Lancet warned of “widespread systematic bias in medical journals against diseases that dominate the least-developed regions of the world” (Horton, 2003, p. 712). The comment drew on a less quoted, currently difficult to find article, in the little known “European Science Editing’ journal, surveying five top peer-reviewed journals in medicine (Lancet, BMJ, New England Journal of Medicine, JAMA, and Annals of Internal Medicine). That study had found that the proportion of space that these journals gave to conditions specifically relevant to Eastern Europe, South and Central America, the Caribbean, North Africa and the Middle East was very small, except for infectious diseases (HIV/AIDS, malaria and tuberculosis), and then mostly by authors from high-income countries or from low-income countries co-authoring with high-income country authors. The study concluded that the “best chances of getting published in one of these journals is only through collaborating with a developed country scientist”.
It must be noted that such “horizontal instability” is not unique to the field of bibliometrics but appears frequently in some of the most commonly used innovation indicators. For instance, the number of academic spin-offs (new firms set up by academics and new graduates), has long been used as an indicator of the entrepreneurial attitudes among academics and university graduates. A possible avenue to measure academic entrepreneurship would then simply be the number of academic spin-offs that a university, a region or a whole country generates. Yet, the way in which this form of academic “spin-offs” are connected to entrepreneurial attitudes and skills varies across contexts. First, in situations of high unemployment, the opportunities provided by self-employment through micro-enterprises can be one of the few avenues open to young graduates to gain employment. Therefore, in regions or countries with different rates of youth unemployment, the entrepreneurial attitudes and culture, and the number of spin-offs will be different. Equally, overtime this relationship will change when, within the same country, the rates of youth unemployment change considerably (therefore, the indicator may become longitudinally unstable). It also has been shown that in highly bureaucratic contexts academic spin-offs can serve as a way to channel academic research (Morales-Gualdrón et al., 2009) . Therefore, and once again, the way in which the number of spin-offs is related to entrepreneurial attitudes will shift across countries depending on the rigidity of academic bureaucracies: in highly bureaucratic environments, and given the same level of academic entrepreneurship, academic spin-offs will be higher.
5 Incorrect models
The second reason why indicators may provide an inaccurate view of the variable of interest occurs when the model linking variable and indicator is not correct. This can occur even when the variable is relevant from a policy perspective and the model is stable. For instance, the assumption that scientific outputs are expressed through journal articles can break completely for certain fields of research. As discussed above, the parameters are unstable when fields with different propensities and patterns of journal publication are compared using non-weighted publication indicators. Yet, when journals are not a relevant outlet for the dissemination of research results, then journal-based publication indicators cannot offer a valid approximation to the assessment of these results even when no comparison is involved. Arguable the situation emerges as well when the datasets used gather only a small part of the relevant publications. For instance, an article published in 2006 stated that only 11% of the active refereed journals in education were included in the Journal Citation Reports (Togia and Tsigilis, 2006). Under these circumstances it could be argued that JCR could not offer at that time a valid approximation to the landscape of research results because the assumption (model) that researchers in the area would publish in JCR journals a representative sample of their production, did not hold.
The situation where experts rate journals according to their perceived quality, and these ratings are then used to assess the quality of organisations, or individual researchers can also be considered as an instance in which the “model” linking indicator with variable proves incorrect. Here the model would state that expert peers have the capacity to identify and rank journal quality, that such quality reflects the quality of the individual items published in these journals, and that researchers whose research results would be “good enough” to be published in these journals will normally chose to do so, before selecting other less prestigious outlets. In some fields, expert-defined journal rankings have become a common foundation to construct research quality indicators. A well-known example of such a ranking is the one produced by the UK Chartered Association of Business Schools (ABS); the ABS ranking have become widely used, in the UK and elsewhere, to assess the research performance of individuals (Nedeva et al., 2012) and for other tasks like the selection of “research active” academics to be submitted to the UK national evaluation exercise (the Research Excellence Framework). Yet, research has shown that the ranking is not neutral in relation to the types of research conducted; in other words, the journal rankings are biased in favour of certain types of research (and therefore, the assumption that the experts would be able to rank journal quality in a reliable, and therefore “neutral” manner, is not correct). Top ranked journals in the ABS rankings have been shown to be less diverse in the disciplines they span than lower-ranked journals and, consequently, the use of ABS rankings as a measurement tool favours groups narrowly focused in business and management when compared to interdisciplinary units (Rafols et al., 2012, p. 1276). This point was made through a comparison of business and management schools with the more interdisciplinary innovation research units. The former received a better assessment when using the ABS rankings, but when using citation-based analysis the situation was reversed and the innovation units appeared as better performers. The authors conclude that the ABS rankings operate as “a general mechanism…[that]…can suppress interdisciplinary research” (Rafols et al., 2012, p. 1262). Ultimately the problem occurs because the underlying assumptions underlying linking the ABS list with the research quality of departments are incorrect.
6 Irrelevant properties
Indicators may provide an adequate and stable representation of properties, but for properties that are not relevant for a specific policy context, or that are unequally relevant across different policy contexts. In other words, indicators do not “illuminate” all areas that constitute relevant social and economic problems that research can address. It can be argued, for instance, that conventional statistical indicators are likely to “illuminate” areas that are relevant to the centres of economic, technological and scientific activities, where they have been developed.
When analysis and policy focus on the fields covered by the available indicators, losing track of the problems and issues that R&D policies need to address we have an instance of “streetlight effect’. The notion of “streetlight effect” draws on an old tale of a drunk searching for his keys under a streetlight (it is also known sometimes as the “principle of drunkard’s search’). The drunk knows he has lost the keys elsewhere, but searches where the light is. The streetlight, like some indicators, does not illuminate all areas of importance. This has long been a recognised problem in the social sciences. Already in 1964, Abraham Kaplan argued that much behavioural science was “vitiated…by the principle of the drunkards search” (Kaplan, 2009, p. 11). In our area, the most commonly used indicators in the study and evaluation of Science, Technology and Innovation policies enlighten only one part, and often not the most important one, of the relevant reality. From a policy perspective, the problem can be depicted by Figure 2. We have a broad set of potential problems that could be addressed through scientific research, technological development and innovation activities. Yet, the resources that can be applied to these activities are finite, and given a variety of policy prioritisation mechanisms only a selection of such problems will be addressed within a specific period and place, by factual activities. Out of these activities, the available indicators will illuminate only a subset.
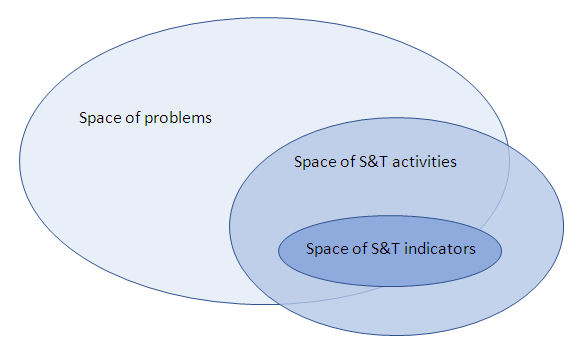
Figure 2: Problems, STI activities, indicators and peripheries
The lack of correspondence between the “spaces” where the societal problems STI policy aims to address, the STI activities that are conducted, and those covered by existing stable indicators leads to the streetlight effect: the attention of the analyst or the decision maker focuses only on the “spaces of indicators” in Figure 2. The indicators may provide an accurate representation of the space they intend to represent, but this space is only partially relevant or just irrelevant given stated policy objectives.5
There are several examples of this situation in the way in which currently used indicators fail to reflect relevant activities in scientific research. Journal publications can fail to reflect research tasks whose main objective is to add to information repositories or datasets. For instance, linguists working on the development and improvement of dictionaries will typically make additional contributions to an existing dictionary instead of publishing journal articles, monographies or books. These tasks can be important, but they are not reflected in existing indicators.
Other examples of relevant STI activities that are not being reflected in the set of commonly used indicators include “grassroots” innovations (i.e. innovations developed by local communities), “frugal” innovations (i.e. innovations aimed at sharp reduction of costs) or “bottom of the pyramid” innovations (i.e. innovation addressing the needs of the poorest populations) . These can make significant contributions to welfare, particularly in developing countries and can also become major drivers of technological and social change worldwide. They are not, however, captured by traditional innovation indicators focusing on high-technology and science-based innovation and have accordingly been described as innovation processes that occur “below the radar” (Pansera, 2013). Similarly, although the economic impact of R&D activities could, in principle, be assessed through the analysis of shifts in economic magnitudes like employment and national product, the assessment of social and environmental impacts is curtailed by the lack of adequate indicators that can be used to assess them.
7 Conclusion: Consequences of problematic indicator use
Any use of indicators for evaluation purposes implies acceptance of a set of assumptions and criteria. First and foremost, we need to assume that the indicators reflect adequately the properties that are important for policy. If the indicators used in an evaluation are taken for granted, then the ultimate objectives of the activity under assessment and the properties associated with these objectives are defined implicitly, without consideration or debate. It is therefore possible that the criteria implicit in the use of indicators will be misaligned with the overall research objectives. This specific problem can lead to a basic policy problem: the generation of an “evaluation gap” “between evaluation criteria and the social and economic functions of science” Wouters, 2014).
This evaluation gap is important because individuals and organisations are likely to adapt their activities to the criteria by which their activities will be evaluated. When such evaluation revolves around a clearly identifiable set of indicators, it is to be expected that those subjected to evaluation (‘evaluands’) will respond by trying to improve their performance according to the indicators of choice. Analysts refer to the situation by which the use of indicators have effect on the behaviours of evaluands as constitutive effects (Dahler-Larsen, 2012).
If the indicators are well designed and fully aligned with policy objectives constitutive effects are actually positive: indicators guide actors toward those activities where policy designers wish them to concentrate. But, when indicators are incorrect this guidance (‘performavity’) is problematic: STI activities will concentrate on areas that are illuminated by the indicators, or on fields unrelated with the policy objectives. Performativity can lead to a narrowing down of the scope of RTD and innovation activities or to research activities being steered in the “wrong” direction. It has, for instance, been argued that the streetlight effect can lead to a suppression of scientific diversity and shift research towards a higher degree of homogeneity (Rafols et al., 2012), at the expense of critical or unorthodox modes of research. This problem is particularly relevant in the face of increasing political pressure to use indicators to inform or even determine policy decisions. Most experts and analysts are aware of the problems and are careful indicator users; but political pressure has led to the indiscriminate and reckless evaluative use of inadequate indicators. The current political quest for output and impact measures, the conflation in current policy discourse of different terms like “evidence’, “data” and “measures’, and the popularity of rankings and benchmarks as evaluation tools are leading to the indiscriminate use of indicators without consideration of their relevance or validity in the specific context to which they are applied.
This situation calls for a rethinking about how indicators are used in evaluation. The three kinds of problems this paper has presented can be addressed through the contextualisation of indicators, i.e. through the design or adaptation of indicators in certain evaluative conditions for addressing particular problems and situations. This suggests a more pluralistic approach to indicator design and use, a flexible use that can provide plural and conditional advice to policy (Ràfols, Ciarli et al., 2012). In our view, this type of (yet underdeveloped) pluralistic approaches should be the future focus of research on S&T indicators.
References
Althouse, B. M., West, J. D., Bergstrom, T. i Bergstrom, C. T. (2009). ‘Differences in Impact Factors Across Fields and Over Time’, Journal of the American Society for Information Science, 60(1), p. 27-34.
Chavarro, D., Tang, P. i Ràfols, I. (2017). ‘Why researchers publish in non-mainstream journals: Training, knowledge-bridging and gap filling’, Research Policy, 46, p. 1666-1680.
Dahler-Larsen, P. (2012). The Evaluation Society. Traducció de Sampson, S. Stanford: Stanford University Press.
DORA (2013). San Francisco Declaration on Research Assessment. Disponible a: http://www.ascb.org/dora/
Gläser, J. i Laudel, G. (2007). ‘The Social Construction Of Bibliometric Evaluations’, a: Whitley, R. & Gläser, J. (eds.). The Changing Governance of the Sciences Sociology of the Sciences Yearbook: Springer Netherlands, p. 101-123.
Hicks, D., Wouters, P., Waltman, L., de Rijcke, S. i Rafols, I. (2015). ‘The Leiden Manifesto for research metrics’, Nature, 520, p. 429-431.
Opthof, Tobias; Leydesdorff, Loet (2010). Caveats for the journal and field normalizations in the CWTS (‘Leiden’) evaluations of research performance. Journal of Informetrics, 4(3), p. 423-430.
Horton, R. (2003). ‘Medical journals: evidence of bias against the diseases of poverty’, The Lancet, 361(9359), p. 712-713.
Kaplan, A. (2009). The conduct of inquiry: methodology for behavioral science. New Brunswick, New Jersey: Transaction Publishers. 4a reimpressió.
Martin, B.R. i Irvine (1983). ‘Assessing basic research. Some partial indicators of scientific progress in radio astronomy’. Research Policy 12, p. 61-90.
Morales-Gualdrón, S. T., Gutiérrez-Gracia, A. i Roig Dobón, S. (2009). ‘The entrepreneurial motivation in academia: a multidimensional construct’, International Entrepreneurship and Management Journal, 5(3), p. 301-317.
Nedeva, M., Boden, R. i Nugroho, Y. (2012). ‘Rank and File: Managing Individual Performance in University Research’, Higher Education Policy, 25, p. 335-360.
Obuaya, C. (2002). ‘Reporting of research and health issues relevant to resource-poor countries in high-impact medical journals’, European Science Editing, 28(3), p. 72-77.
Pansera, M. (2013). ‘Frugality, Grassroots and Inclusiveness: New Challenges for Mainstream Innovation Theories’, African Journal of Science, Technology, Innovation and Development, 5(6), p. 469-478.
Rafols, I., Leydesdorff, L., O’Hare, A., Nightingale, P. i Stirling, A. (2012). ‘How journal rankings can suppress interdisciplinary research: A comparison between Innovation Studies and Business Management’, Research Policy, 41(7), p. 1262-1282.
Rafols, I., Ciarli, T., van Zwanenberg, P. i Stirling, A. (2012). ‘Towards indicators for ‘opening up’ science and technology policy’. Proceedings of 17th International Conference on Science and Technology Indicators, Vol. 2, p. 663-74. Disponible a: 2012.sticonference.org/Proceedings/vol2/Rafols_Towards_675.pdf
Ràfols, I., Molas-Gallart, J., Chavarro, D. A., & Robinson-Garcia, N. (2016). On the dominance of quantitative evaluation in‘peripheral’countries: Auditing research with technologies of distance. Disponible a: https://papers.ssrn.com/sol3/papers.cfm?abstract_id=2818335
Rijcke, S. d., Wouters, P. F., Rushforth, A. D., Franssen, T. P. i Hammarfelt, B. (2016). ‘Evaluation practices and effects of indicator use: a literature review’, Research Evaluation, 25(2), p. 161-169.
Smith, K. (2004). ‘Measuring Innovation’, a: Fagerberg, J., Mowery, D.C. & Nelson, R.R. (eds.). The Oxford Handbook of Innovatio. Oxford: Oxford University Press, p. 148-177.
Stirling, A. (2012). Sharing the Lathes of Knowledge: broadening out and opening up policy metrics, models and indices. Obra no publicada.
Togia, A. i Tsigilis, N. (2006). ‘Impact factor and education journals: a critical examination and analysis’, International Journal of Educational Research, 45(6), p. 362-379.
Van der Meulen, B. (1998). ‘Science policies as principal-agent games: Institutionalization and path dependency in the relation between government and science’, Research Policy, 27(4), p. 397-414.
Van Leeuwen, T. (2013). ‘Bibliometric research evaluations, Web of Science and the Social Sciences and Humanities: a problematic relationship?’, Bibliometrie – Praxis und Furschungs, (Band 2).
Vessuri, H., Guédon, J. C. i Cetto, A. M. (2014). ‘Excellence or quality? Impact of the current competition regime on science and scientific publishing in Latin America and its implications for development’, Current Sociology, 62(5), p. 647-665.
Wilsdon, J., Allen, L., Belfiore, E., Campbell, P., Curry, S., Hill, S., Jones, R., Kain, R., Kerridge, S., Thelwall, M., Tinkler, J., Viney, I., Wouters, P., Hill, J. i Johnson, B. (2015). The Metric Tide: Report of the Independent Review of the Role of Metrics in Research Assessment and Management, London: HEFCE.
Wouters, P. (28 August 2014). ‘A key challenge: the evaluation gap’, The Citation Culture. Disponible a: https://citationculture.wordpress.com/2014/08/28/a-key-challenge-the-evaluation-gap/ (Consulta: 18.08.2015).
Notes
1 We should highlight that we believe “academic quality” to be too generic and ambiguous, and its use in evaluation to be problematic. Instead we would suggest to use “scientific impact’. Here we use the notion “academic quality” since it is a property often assumed behind one of the most common indicators: citations.
2 We acknowledge that this is a simple framework. More complex frameworks regarding the meanings of measure or metric, observation and variable might be helpful in certain conditions (Stirling, 2012). For the concerns of this article, we believe that a framework of “property” vs. “indicator” is robust to explain the main challenges of research evaluation.
3 Impact factors refer to the average citations received during a specific time window (typically two years after publication) by articles published in the journal. Although the use of impact factors as indicators of quality has long been criticised a publication in a high-impact journal is still often considered as being of higher quality.
4 An interesting issue to consider is how the unequal language coverage results in an unequal coverage of different disciplines and topics covered (Archambault et al., 2006; Piñeiro and Hicks, 2015).
5 The problem is worsened when such selective attention is unintended, when it is implicitly and wrongly assumed that the whole space of STI activities is fully covered by the indicators we are using to assess them. Using indicators that illuminate only parts of an activity to measure performance across the whole activity is a common practice.
 Creative Commons licence (Attribution-Non-Commercial-No Derivative works). They may be consulted and distributed freely provided that the author and publisher are quoted (in accordance with the “Recommended citation” section in each of the articles). However, no derivative works (translation, change of format, etc.) may be made without the publisher’s permission. Therefore, it meets the definition of open access form the Budapest Open Access Initiative declaration. The journal allows the author(s) to hold the copyright without restrictions and to retain publishing rights without restrictions.